'Yes' in the IndyRef and 'Leave' in the EU Ref: did they have the same drivers?
A new look at the data.
Graham Stark
4th December 2016
Brexit, the US Presidential election, the rise of far-right parties in France, Holland, Austria and elsewhere all seem to be part of a new and disturbing Populist wave. Was the Scottish Independence referendum part of that? It’s certainly been portrayed in that way: Wings Over Scotland - not everyone’s cup of tea, but usually careful and accurate - has a compendium of claims on this from the Twittersphere.
The Indie and EU Referendums certainly felt very different to me, and the Scottish Independence movement seems a very different thing to Vote Leave. But that’s just one person’s impressions. Sometimes, you have to look at the numbers - the big picture can be very different.
The Wings blogpost uses some opinion poll data to make a case for the IndieRef being different. That’s useful, but I’d like to look at this in a slightly more systematic and precise way, using techniques from my day-job doing economic modelling.
There are now some good empirical studies of the type I have in mind, trying to explain the Brexit vote:
by contrast, Eric Kaufmann of the London School of Economics also uses the BES dataset but argues against the primacy of economic factors in the Brexit Vote 2.Instead he argues for authoritarian and conformist attitudes as the main driver.
A study for the Resolution Foundation by Stephen Clarke uses local authority level data - unemployment rates, educational attainment, numbers of recent immigrants and so on, to paint a picture somewhere between the two - they find high recent immigration a driver.
What I’m going to do here is build a statistical model in a similar vein to these, using a later version of the same data as the LSE and Rowntree study. Like those studies, my model uses a variety of factors (“explanatory variables”, in the jargon) to explain how people voted in the European Referendum. I’ll then apply the model to the Scottish3 part of the BES data, to explain the IndieRef vote4. I show that the model explains both votes well, but the factors (age, sex, etc.) often work very differently in the two cases - sometimes working in the opposite way, sometimes working strongly in one case but not the other.
A companion note gives more detail. There, you’ll fine everything you’ll need to replicate and extend the model, discussions of the choices I’ve made, and results for several different model variants. But, for now, in summary:
I’m building a statistical model (a “binomial Probit regression”, in the jargon) that shows how the vote in both referendums was influenced by various factors such as education, age, income and political allegiance;
I’m using a more recent version of the same BES data as the Rowntree and LSE studies. The data in those studies doesn’t actually have peoples’ Brexit vote in it; instead they used either intended votes (Rowntree) or attitudes to the EU (LSE). My version does have people’s actual Brexit vote, as well as the IndieRef vote;
the model allows each factor to be isolated from the others - so, for example, we can study the influence of education on voting, holding income and other factors constant. This is important as our explanatory variables are often correlated with each other - better education usually leads to higher incomes, earnings increases (up to a point) with age, and so on;
my model is closest in spirit to the Rowntree study, though I do some things differently. There are also some ideas from the other studies thrown in;
I’m going to use the same set of factors (income, age, gender and so on) to explain both the Scottish Independence and EU Referendum Votes.
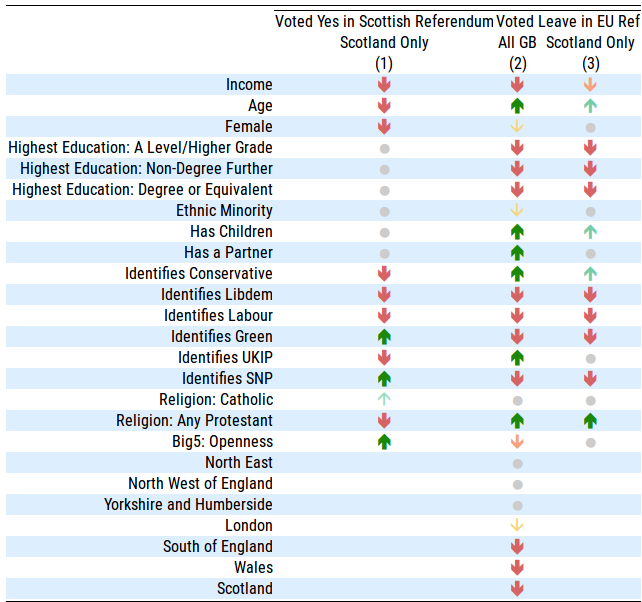
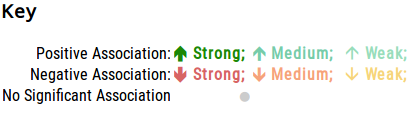
Table 1 summarises the main findings. This table is the simplest way I can think of to boil down the huge amount of information my computer program spits out. I hope it makes sense; the full data is in the companion paper. Each column summarises one of our models that explain the votes. The first column (1) is our model of the Scottish Independence vote. Columns(2) and (3) are models of the EU Referendum; (2) uses data for Great Britain as a whole 5, and (3) just uses people living in Scotland. The rows summarise the effect of each variable on the vote. The green up-arrows ‘’, ‘’ and ‘’ indicate things that have a significant positive effect on a ‘Yes’ (or ‘Leave’) vote, from the strongest to the weakest6. Likewise, the red down arrows ‘’, ‘’ and ‘’ signify negative effects, strongest to weakest. Variables that don’t appear significant are indicated with ‘’. Although my models do a good job of capturing how the votes varied by income, age, sex and so on, they of course don’t explain everything - you could posses all the indicators that were associated with a ‘Yes’ note, but still have voted ‘No’, and vice versa.
Table 1
Let’s look at IndyRef first. That’s column (1):
The first cell summarises the influence of income on the Scottish Independence vote. The ‘’ in that cell indicates that income has a strongly significant negative effect on the likelihood of voting “Yes” in the IndyRef - the higher your household’s income, the less likely you were to vote ‘yes’, all else equal, and we can be confident this effect is real;
Next we have age - this is also significantly negative - the older you are, the less likely to vote ‘yes’ 7;
You interpret ‘’ in the next row “Gender - Female” as meaning that women were significantly less likely to vote ‘yes’ than men with the same level of income, qualifications, etc.;
The next three lines show the effect of increasing levels of education. There’s essentially no effect. People of all levels of education were equally likely to vote for Independence;
Likewise, family circumstances seem to matter little;
Political affiliation does matter 8. The results go the expected ways, though it’s tricky to interpret this - whilst it’s quite plausible that liking the SNP would make someone more likely to vote ‘yes’, it could just as easily be that that people identify with the SNP because they want independence. Likewise, in reverse, for the Conservative (and Unionist) party. We might need a more sophisticated model to capture what’s really going on there; that would be an interesting exercise. For Labour, the Greens and the Liberal Democrats it’s perhaps more plausible that the effects we see run from identification with the party to which way people voted - perhaps some people really do follow the lead of their parties.
Practising Protestants were significantly more likely to vote ‘No’ (and Catholics slightly more likely to vote Yes)..
Finally, in the spirit of the LSE study, we include a measure of how voting is influenced by a person’s openness to new experiences. “Openness” is defined as: “a general appreciation for art, emotion, adventure, unusual ideas, imagination, curiosity, and variety of experience”. Openness in this sense is strongly associated with a “Yes” vote.
To make this a bit more concrete, imagine a 30 year old woman, politically neutral, on median houshold income (about £27,000 in this dataset), with an HND, and scoring averagely on our Openness scale. Our model gives her a 40% chance of having voted ‘Yes’ in the IndieRef. A man in the same position would be 7 points more likely to vote yes than this, whereas an otherwise similar woman aged 70 would be 9 points less likely. SNP supporters, reasonably enough were virtual certainties to vote yes, regardless of any other characteristic.
In sum, the picture that emerges is that Yes was in most respects the progressive, optimistic, Left-leaning vote. Yes votes were associated with lower incomes, but people of all education levels voted both ways, and open-minded and the young, were more likely to vote ‘yes’. Conventional politics and religion mattered in interesting ways.
Next, the Brexit vote. We’re modelling a “Leave” vote, so Up-Arrows mean “more likely to vote ‘Leave’. Column 2 uses data from the whole UK; column 3 just uses people living in Scotland. For the all-UK case I’m going to add in variables showing which region people lived in; this can tell us (broadly) whether there really was a ‘London Effect’, or indeed ‘Scottish Effect’ in the Brexit vote that can’t be explained by Londoners and Scots having different levels of education, income, and so on9.
Reading down column 2 shows a very different pattern than for the Indie ref, one which does seem consistent with the Populist,or even reactionary, interpretation that many have put on the vote. There is a strong link between education and a ‘Leave’ vote: those with degrees or ‘A-levels’ were much more likely to vote “Remain”. Political affiliations work in reverse from the IndieRef, with Conservatives much more likely to vote Leave and Socialists, Liberals and Nationalists much more likely to vote ‘Remain’. “Leave” rises steadily with age. The more open minded you are, the less likely to vote “Leave”. The regional effects are interesting: , once we’ve controlled for the other factors, there is no real evidence of a distinct “London effect” for Remain, or a North East of England effect for Leave 10. But there are pro-Remain Scottish and Welsh effects - although Wales voted for Brexit, in this model the Leave vote was lower than you’d expect given incomes, education and age.
Column (3) runs the same analysis for Scottish voters only. Here, you see some of the patterns of the UK-Wide Brexit vote coming though, notably the negative effects education, income, and age, and political affiliations are similar, but other things (openness, gender) that mattered GB-wide were not significant in Scotland.
To return to our example, our 30 year old woman would have had about a 30% chance of voting ‘Leave’ if she was living in Scotland; an otherwise similar woman from the Midlands of England would have had a 40% chance of voting leave Leave. At age 60, the chances of voting Leave would be about 12% higher.
It’s customary to end work like this with “more research is required”. And it is: there are certainly many things that could be done better, or at least differently. If anyone is interested in taking this on, most of what you’ll need is available. But I’m confident that the key findings here are robust: empirically, IndieRef and the Brexit vote were very different things.
Notes
The study was completed after the vote but before the edition of the BES with the actual data on the Brexit vote had been released; instead, Goodwin and Heath model intention to vote (6 months before), which is a good though not perfect correlate with actual vote. I’m using the version (9) of the BES with the actual vote in it.↩
Kaufmann’s study was carried out even earlier, before the actual Brexit vote: instead of explaining the vote he is modelling the extent to which people disapprove of the EU, which, too, is a good predictor of the final vote.↩
‘Scottish’, as is customary, simply means people living (or at least interviewed) in Scotland. Adding country of birth as an explanatory variable would be interesting.↩
See the Technical Note for more on all this; there is in particular a tricky issue here that many people have dropped out of the survey between the Indie and Brexit votes.↩
‘Great Britain’ rather than ‘United Kingdom’ since Northern Ireland is not in the BES data.↩
A technical aside: I’m using statistical significance for this (the p-values) rather than, for example, effect size. So I give more weight in that table to a small but certain influence than to a potentially large effect which has more uncertainty attached to it. The American Statistical Association has a good short paper on this↩
in the IndieRef case (but not the Brexit vote), this is actually a bit of a simplification - ‘Yes’ is modelled to rise till about age 40 and fall thereafter, whereas ‘Leave’ rises steadily at all ages. This is ‘all else equal’, and of course incomes generally rise between those ages, which may explain why simple tabulations from polling data don’t show quite this pattern. See the Technical Note for more detail.↩
These are the parties people identify with; they needn’t be members of them.↩
in the Technical Note I report a version of the model without these regional dummies, showing that adding or removing these variables doesn’t affect our other conclusions in any major way. So model in column (2) is still comparable with the Indie ref one even though it has more variables.↩
 ’, ‘
’, ‘ ’ and ‘
 ’ indicate things that have a significant positive effect on a ‘Yes’ (or ‘Leave’) vote, from the strongest to the weakest6. Likewise, the red down arrows ‘
 ’, ‘
’, ‘ ’ and ‘
 ’ signify negative effects, strongest to weakest. Variables that don’t appear significant are indicated with ‘
 ’. Although my models do a good job of capturing how the votes varied by income, age, sex and so on, they of course don’t explain everything - you could posses all the indicators that were associated with a ‘Yes’ note, but still have voted ‘No’, and vice versa.